ActiveGraf Predictive Dashboards and Presentations for Corporate Bankers
In this article, we’re going to take a close look at how ActiveGraf enabled corporate banking dashboards and presentations can drive success in bankers’ client interactions.
We will discuss and learn the answers to the following questions:
- What type of predictive dashboards deliver immediate game-changing answers, deep client engagement, and increased revenues?
- How can you conduct real time scenario analysis together with clients, more quickly building trust and dialogue, rather than waiting for manual recalculations?
- Which methods are most successful in reducing errors in updates and model edits?
- Can your team deliver what-if analysis dashboards within existing workflows without replacing existing tools?
Standard dashboards are often overwhelming, leaving most viewers struggling with data and conclusions defined by others, without allowing for meaningful viewer-driven discovery or insights.
With ActiveGraf enabled interactive presentations and dashboards you can boost understanding of drivers and impacts effortlessly by just clicking and dragging graphs. All you need is your Excel model and a PowerPoint presentation. You can learn more about the concept (here).
In what kind of presentations and dashboards can ActiveGraf be useful for bankers?
Examples of high-value what-if analysis applications for banking include:
- financial product sales presentations (hedging, factoring, lending),
- relationship banking /trusted advisor strategic discussions (optimizing capital structure, cost of funds, refinancing risk, debt capacity, rating migration, financial flexibility),
- scenario analysis in risk management (sensitivity analysis, risk factor analysis, client limit reviews, restructuring, capital structure optimization dashboards),
- scenario analysis dashboards for strategic decision making.
Harness the power of easy, immediate recalculation to drive informed decisions and results
ActiveGraf interactive presentations build and enhance trusted advisor-client relationships by providing instant answers to unlimited spontaneous scenarios. Empower your client to influence your presentation and dialogue by providing updated assumptions live, and view results right within the meeting. This power and simplicity builds trust and clearly differentiates both you and your institution.
What are the key determinants of success in creating presentations for client engagement?
- Maintain focus on your client’s strategic objectives at every stage of your dialogue
- Reduce noise and complexity, identifying key drivers and their impact on your clients’ goals.
- Encourage and incorporate input and feedback regarding key variables and assumptions
- Always be prepared to knowledgably discuss spontaneous variants of the analysis and results in your presentation.
Learn more about how to use ActiveGraf in presentation mode (YouTube link).
You can easily create immersive scenario-enabled presentations from your existing Excel models without disturbing your current workflow. Check out this overview of how to create your datasets (Youtube link).
Corporate Sales Presentation Examples
Foreign currency hedging dashboards
Hedging and foreign currency (“FX”) risk management solutions help your clients manage and mitigate volatility in the foreign exchange market. Whether purchasing machinery, selling to clients, or paying rent across country borders, currency exchange rates can create uncertainty. Help your clients to understand their level of risk and show how to stabilize cash flows, protecting budgeted rates.
As a treasury sales banker, it is essential to help clients identify and manage their currency risk. You can provide the support they need, empower them to make informed decisions regarding currency exposure, and help plan future foreign exchange hedging strategies. Simplify key concepts like value at risk and volatility by demonstrating how they react to variations in the markets, hedging products, and strategies.
Sensitivity analysis in risk management
For the annual loan review, the goal is to visualize the risk and get quick insights through creditworthiness analysis. We are interested in knowing whether the client can still meet its obligations under stress testing for varying adverse conditions, and to what degree credit quality and debt capacity are impacted.
Corporate relationship and risk managers can negotiate term loans more quickly and effectively with ActiveGraf enabled presentations by:
- reducing time spent on reporting and presentation iterations,
- fine–tuning the financial projections of the business in real-time,
- identifying risks and presenting alternate scenarios,
- improving insight into management of key risks.
These scenario analysis dashboards track different financial KPIs, as you change your assumptions you immediately see the impact. This approach makes it easy to take the right steps quickly.
Financial structuring predictive dashboard
Restructuring dashboard
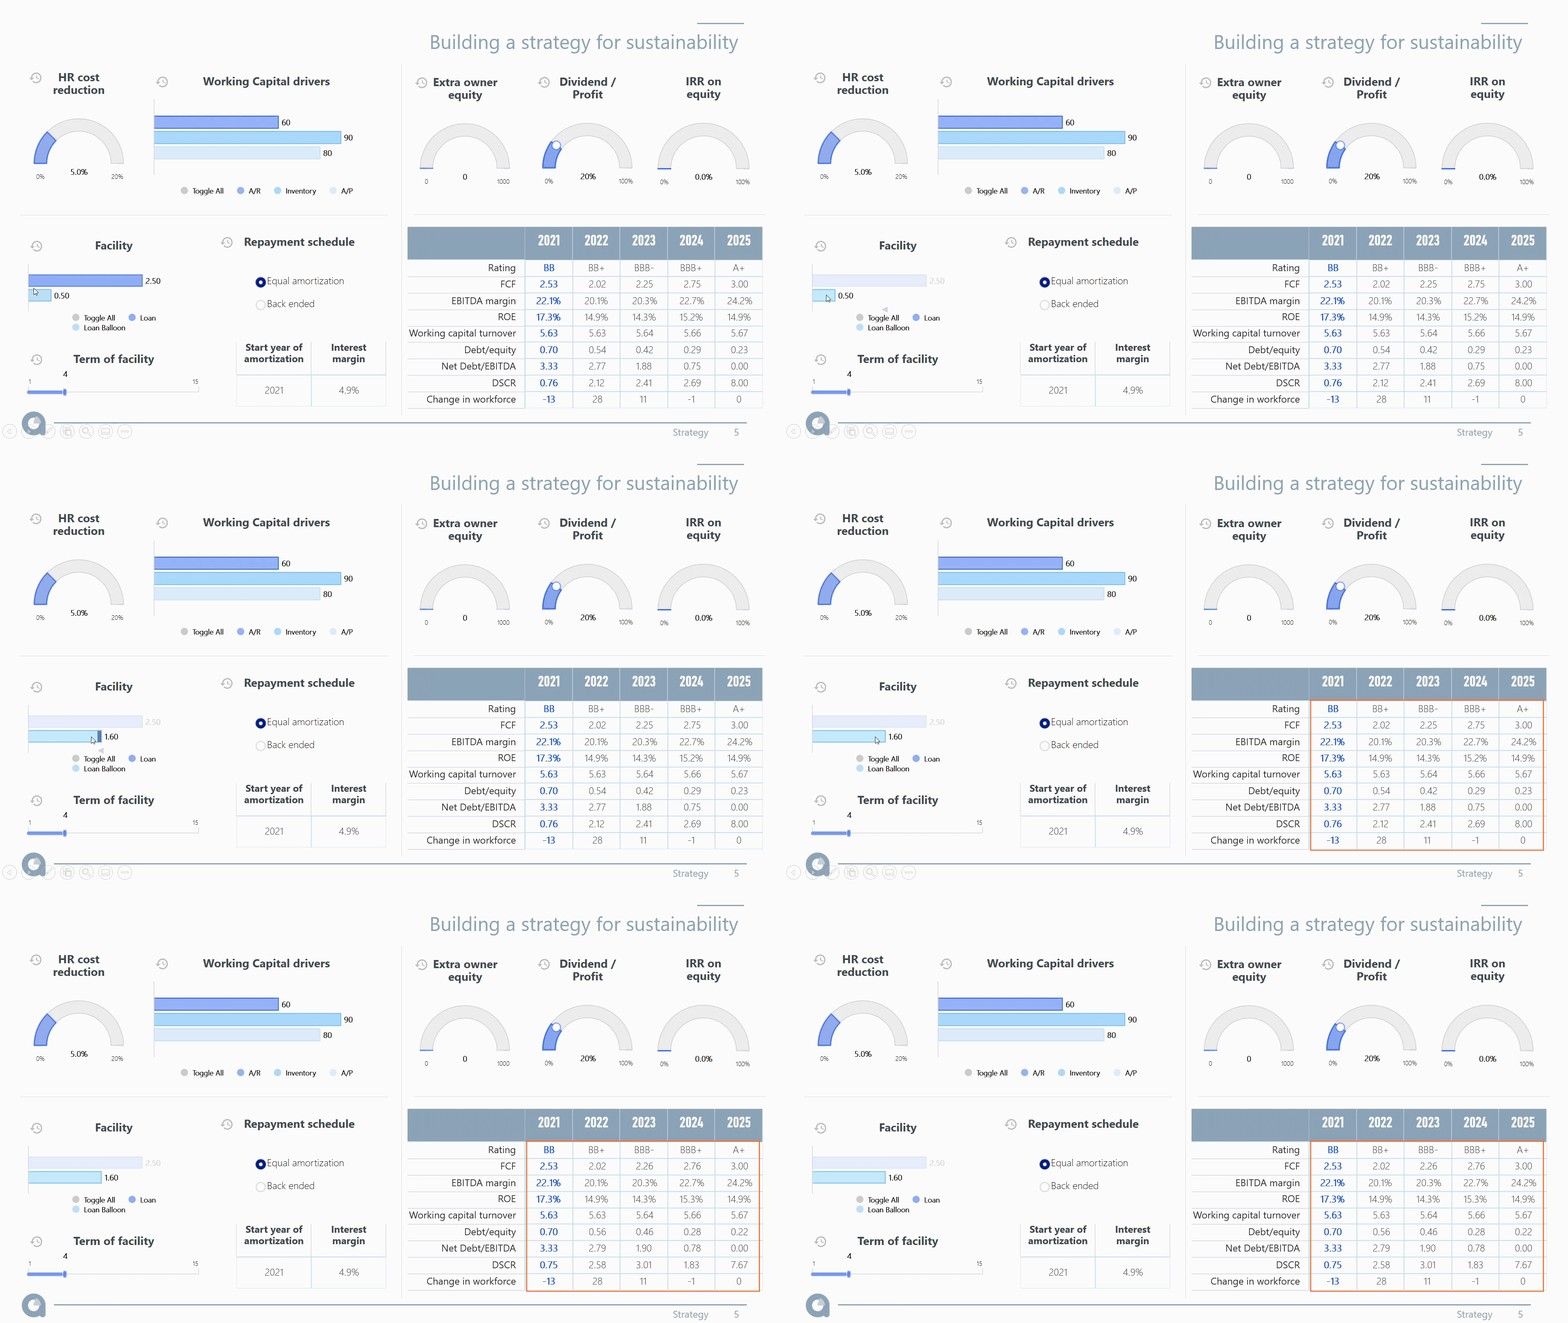
If you would like to see more use cases and dashboards, visit our YouTube channel, or download a financial modeling scenario analysis dashboard and presentation right now (here). Don’t forget to download ActiveGraf and activate your free one-month trial first (here).
Related Post
Comments are closed.




7 Comments