Building an interactive scenario analysis presentation
On this page you will learn the foundational skills to use ActiveGraf and will be able to build interactive presentations and dashboards. You will have a clear picture of ActiveGraf capabilities and will be confident in applying ActiveGraf.
Before you move on, make sure that ActiveGraf is installed properly, with this one step:
Working with and presenting ActiveGraf enabled presentations require a locally installed ActiveGraf license. Users without a working license will not be able to benefit from the interactive analysis features.
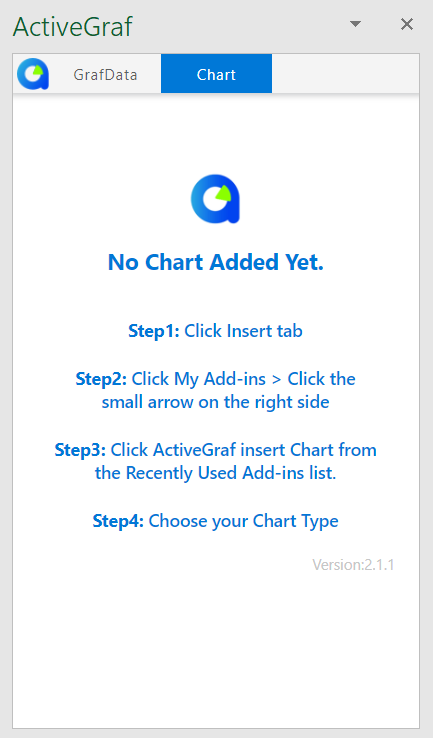
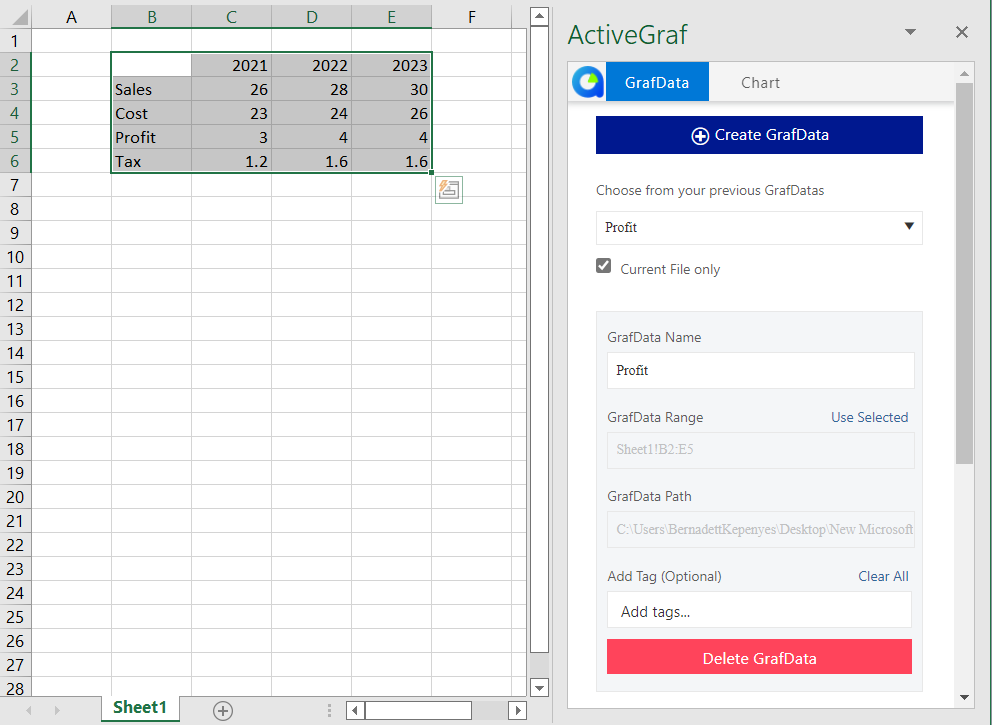
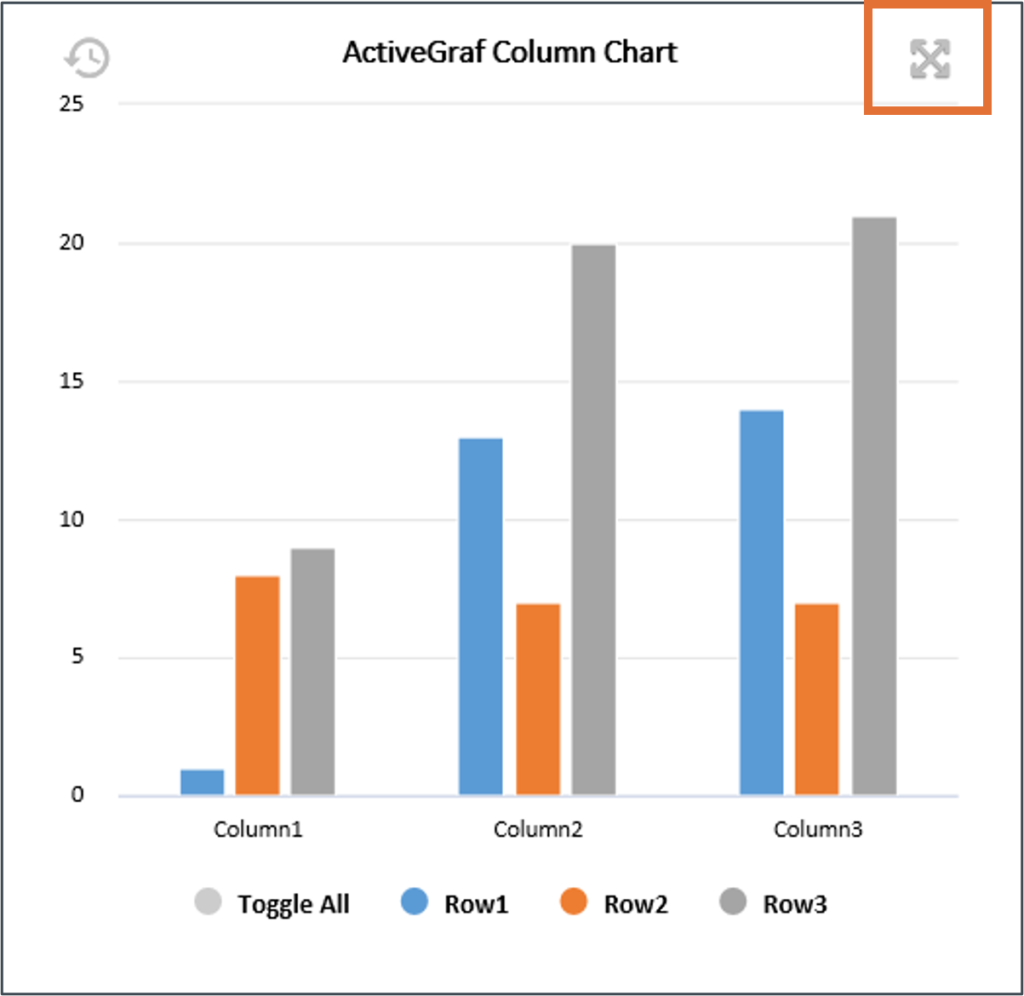
If you see a properly loaded TaskPane as in the picture, you are ready.
If your screen shows something different than the image, please go through the Minimum Install Requirements and the Easy Install steps. For detailed information on enterprise and network environment settings to install ActiveGraf, open this IT checklist. If you encounter any issues, do not hesitate to contact us.
How do you open the TaskPane? Go to the ActiveGraf Ribbon, then click on Open TaskPane.
Content
What is ActiveGraf, and when is it most useful?
ActiveGraf’s unique power is to enable immediate and easy recalculation for decision making – effortlessly adding a ‘what-if’ layer literally anyone can use on even the most complex forecast, impact or scenario analysis made in Excel.
Analysts can also save hours per day by having presentations and dashboards automatically updated and not having to manually run iterations. They can also focus on their core area of expertise – analysis – rather than spending much of their time on interpreting meeting notes, and updating calculations and graphs.
With ActiveGraf, as opposed to traditional visualization and graphic tools, the graphs also serve as multi-point inputs. Without the need to disrupt the meeting or involve the chain of people leading to the individual that created the calculations, immediate answers are provided. This write-back and immediate refresh capability exponentially increases the efficiency, understanding and effectiveness of decision making and trusted advisor/consultative selling.
How to use an ActiveGraf enabled presentation
Before the Presentation
Open your ActiveGraf enabled PowerPoint file and wait for the ActiveGraf logo in the Task Pane to spin. The Task Pane opens automatically for existing ActiveGraf enabled files (if not, open it manually).
ActiveGraf recognizes the active content and opens all connected Excels automatically! Please wait until all of the connected Excels open.
Click on a slide that contains an ActiveGraf, and the chart starts loading.
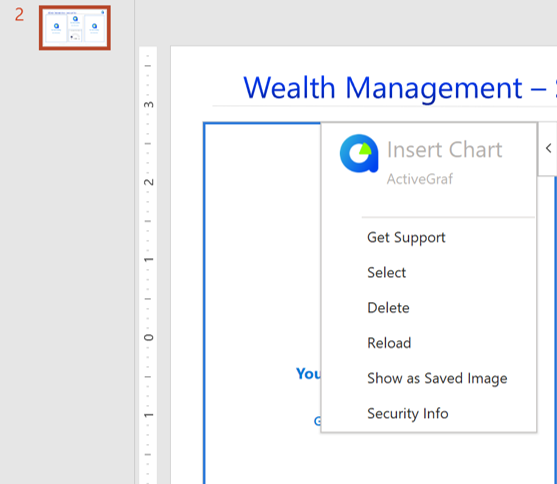
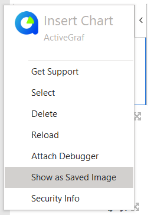
Load all charts in every slide before open presentation mode in PowerPoint. On the rare occasion that a chart gets stuck loading, just click on the top right corner of the given chart, a dropdown menu will appear and choose “Reload”.
Turn off the AutoSave function – it slows down your machine and can cause time-outs.
The usage in presentation mode is easier if the „On Mouse Click” is disabled (Transition > Advance Slide).
Click & Drag
Just Click – Drag – Click to release on any chart data point and easily set the new value. Excel sync is automatic.
Undo, Redo
Check the steps with the versioning tool. Very fluent and easy. Just click Undo / Undo All or Redo / Redo All and immediately see the results of different versions.
You can Turn on or Off this function on the TaskPane > Show History.
Filtering
Select the data series you want to filter on the chart.
When you are making the presentation, it is not necessary to choose which data series are important, because they can all be displayed on the same chart. During the presentation, you can filter the data series to follow your discussion.
The basics: connecting Excel data and calculations to ActiveGraf charts
First Step
ActiveGraf enabled files (Excel, PowerPoint) must be saved on a local drive, network drive or cloud mirrored drive (OneDrive, OneDrive for Business, Box, Dropbox, Google Drive). ActiveGraf Archives (.actg) can be shared to any drive.
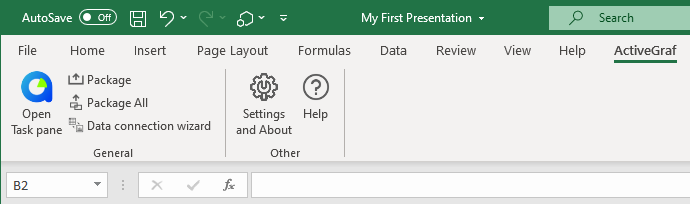
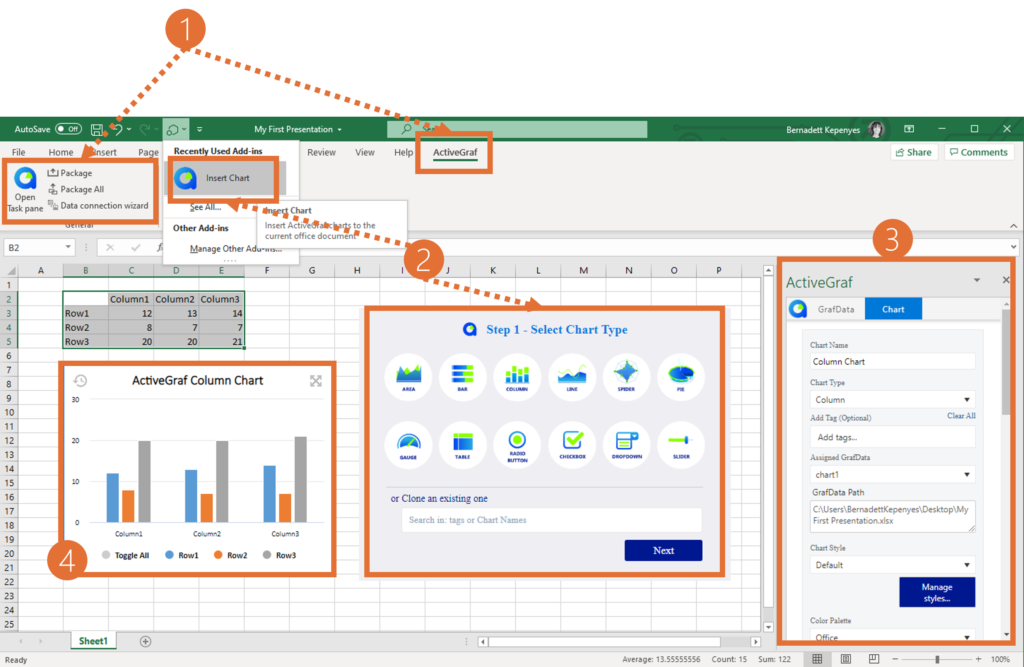
ActiveGraf System Components
ActiveGraf Office Ribbon (1): The Ribbon contains the main menu functions of ActiveGraf.
Insert Chart Command and Pane (2): This panel shows the basic chart types available. Select Insert Chart from the Quick Access menu to initiate chart placement.
Task pane (3): The Task pane contains configuration options.
Charts (4): Charts display bi-directionally synchronized interactive data visualizations.
Create GrafData and Insert Chart
When you are ready with your model, select a data range and create a GrafData in Excel. Then open the PowerPoint and Insert a new chart. (When you newly create GrafData or ActiveGraf charts, first you have to open the Taskpane).
Hint: Add Tags to the GrafData. Tags help to find specific GrafData (the tag is saved by hitting the SPACE bar and clicking outside the input area).
Number vs Formula
Excel formula driven values are not editable. Excel formulas remain intact, but the results of any calculations dynamically update on all connected Charts. When you click and drag on a formula driven chart element, it triggers the zoom feature instead.
Modify and Delete GrafData
Choose GrafData from your GrafData library. The Excel data range bound to the selected GrafData will automatically be highlighted in the excel worksheet. Note: the Current File Only check box is ticked by default, and narrows the list to the GrafData originated in the current Excel file. To view your whole GrafData library, uncheck the box.
Available editing options: – Change the name of the GrafData, change the range of the GrafData (highlight the dataset, then click “Use Selected”). – Add Tags to the GrafData, – Delete GrafData.
How to design presentations and dashboards
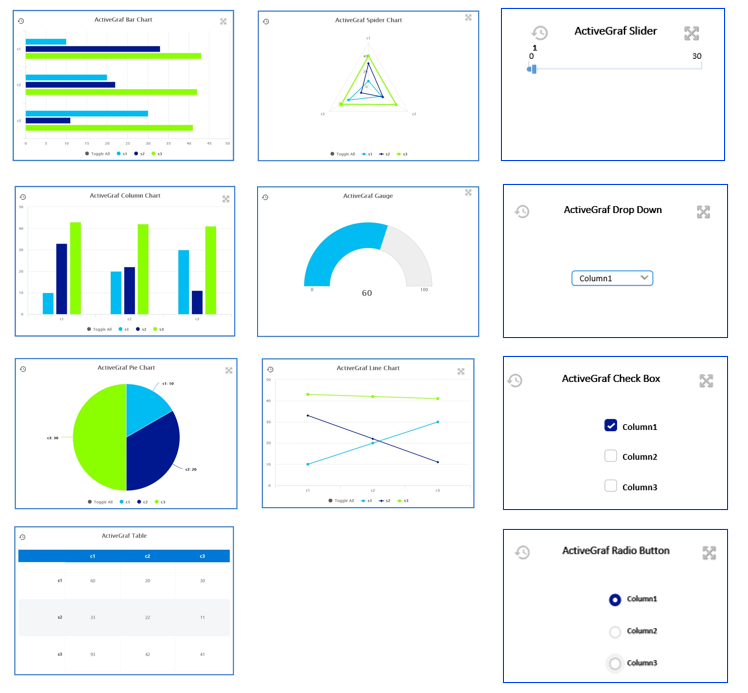
Chart Types
ActiveGraf Charts are interactive, bi-directionally synchronized with their bound data source (GrafData). Charts display data and provide interaction options.
ActiveGraf charts provide intelligent, auto scale data display using many different chart formats.
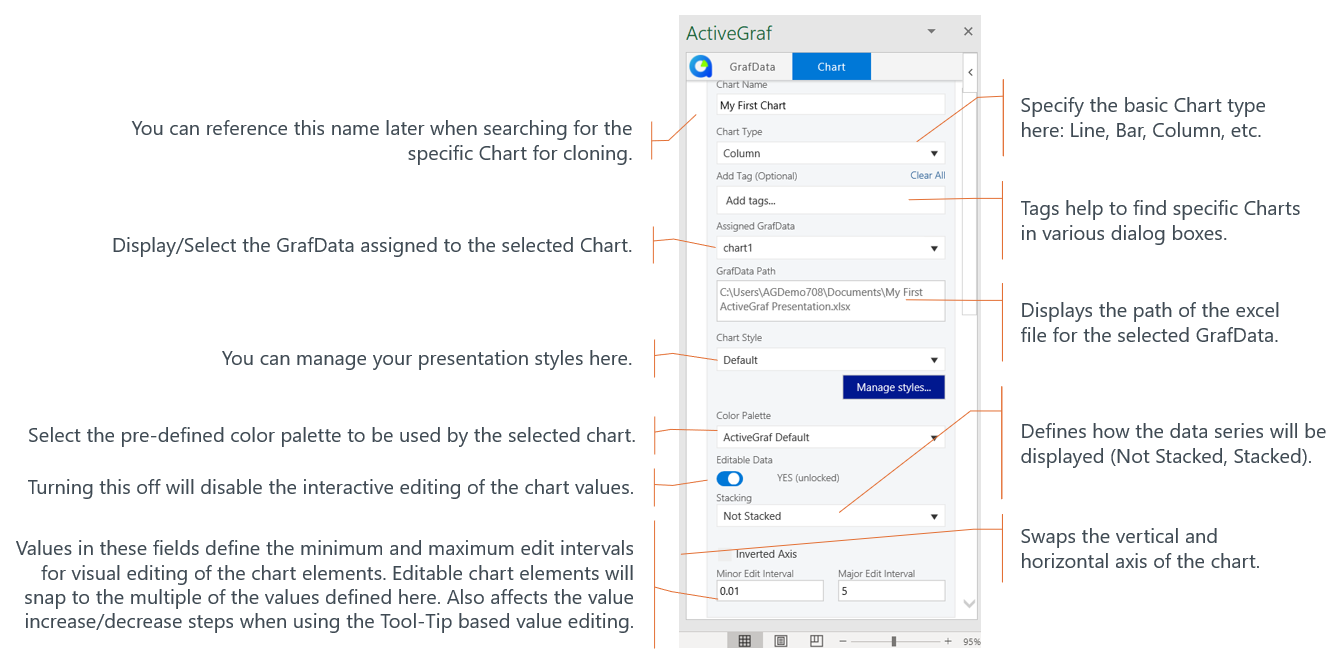
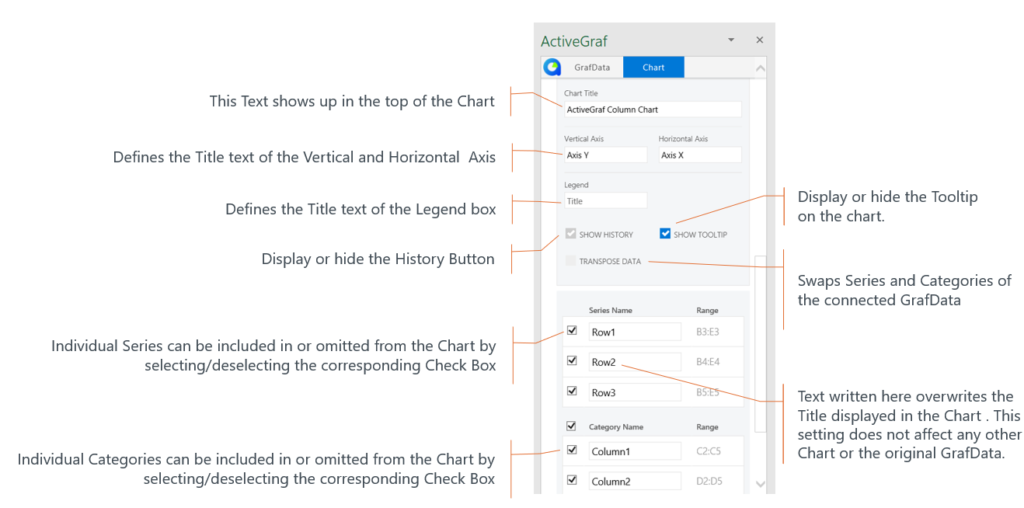
TaskPane functions
The Task Pane is the host for most ActiveGraf actions. It must always be enabled and open when using ActiveGraf functions. The Task Pane is used to create GrafData (Excel) and configure the global properties of ActiveGraf Charts (Excel and PowerPoint).
Basic Chart Settings
Advanced Chart Settings
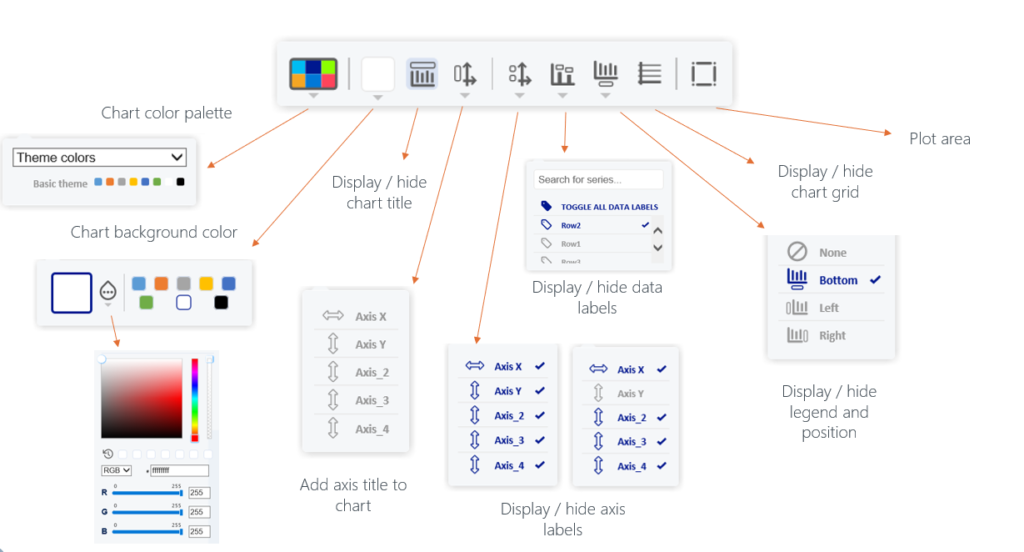
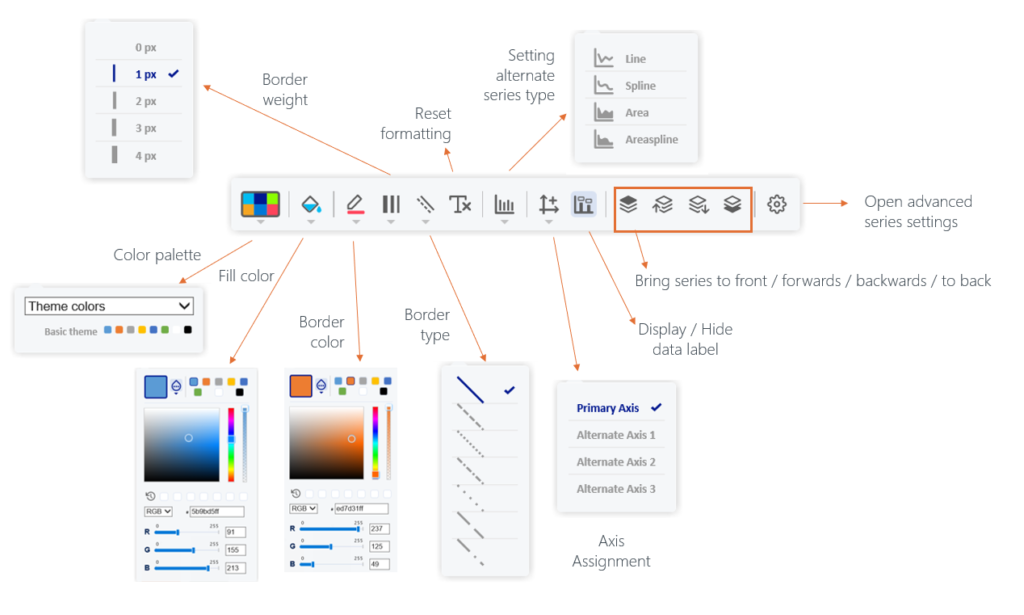
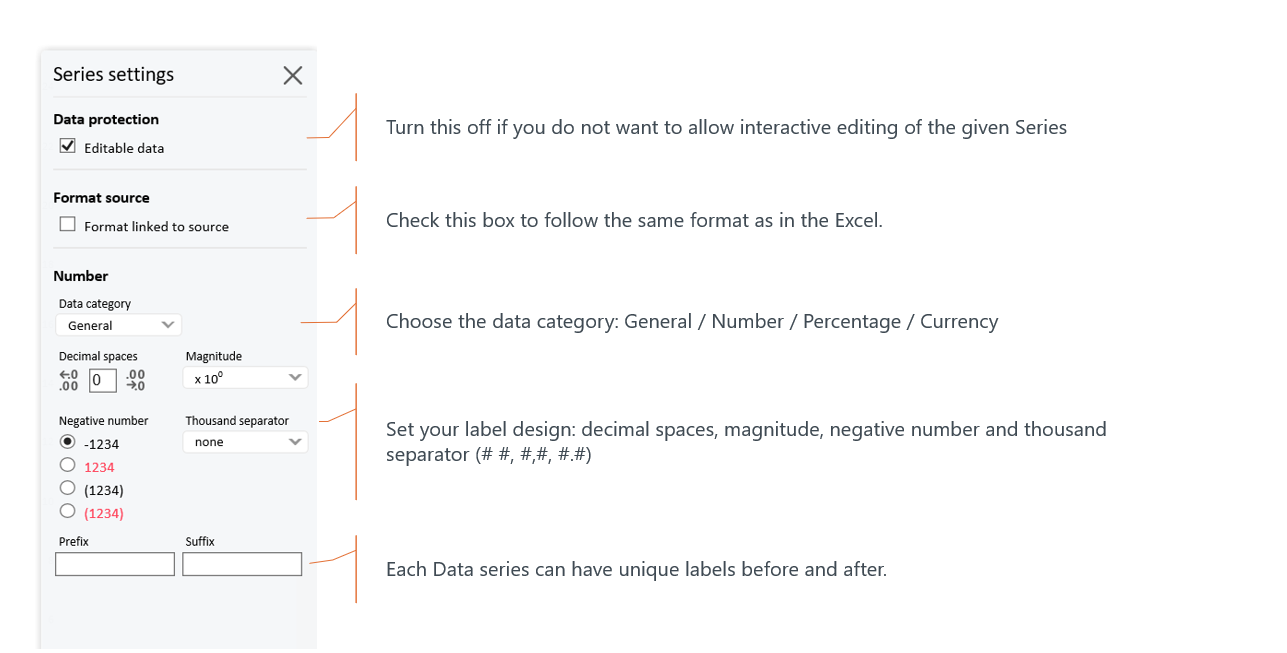
Chart Formatting (Design editor)
To open the Design editor, click on the top right corner of the given chart.
Chart Formatting
Series Formatting
Advanced Formatting
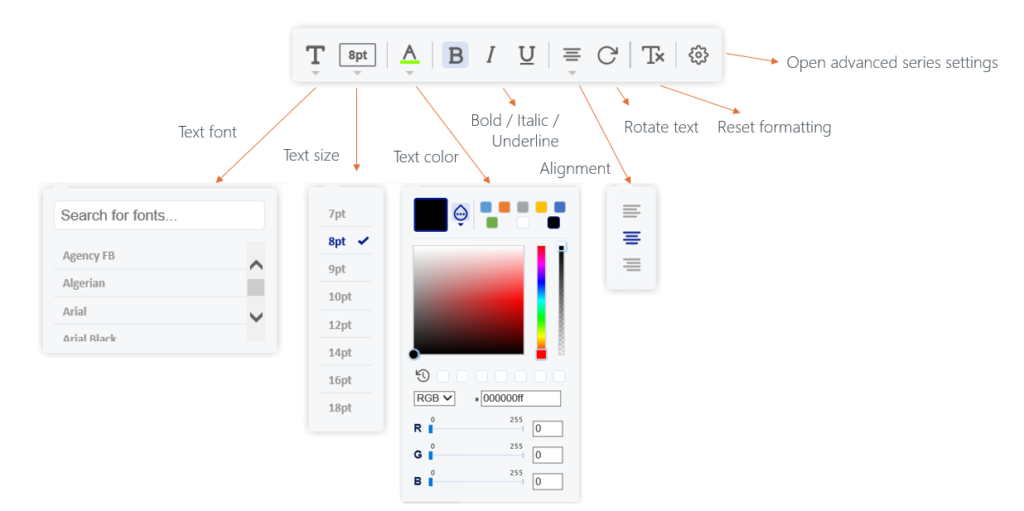
Text Formatting
How to use ActiveGraf enabled files in your existing workflow
Packaging
When you reach certain milestones during building the presentation, we encourage all users to save their ActiveGraf enabled file and work by Packaging to our .actg file format often. In fact, packaging after every stage of work is a best practice, just as you would with any individual PowerPoint or Excel file. Think of .actg files as the ActiveGraf file that contains all ActiveGraf related info needed for a specific scenario planning presentation or dashboard, including all PowerPoint, Excel and ActiveGraf content.
Actg files are also the primary means of achieving scenario versioningandarchiving as well as sharing and collaborating with ActiveGraf enabled content.
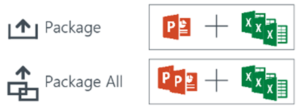
Package: the currently open PowerPoint file (from which you start the packaging) with the corresponding Excel file(s).
Package All: all currently open PowerPoint files with their corresponding Excel file(s).
Versioning Excel and PowerPoint files
Just as you would do in your existing workflow, you can create, and collaborate on, Excel versions of your model (but note that non-ActiveGraf users should not change the structure of your spreadsheet). In the PowerPoint, go to Data Connection Wizard and manually connect or re-connect any version of your Excel. (e.g. you have a PowerPoint Client Presentation Template, and you tailor each Excel model version to each client.)
When you Save As a PowerPoint file ActiveGrafs will connect to the original Excel file. For instance, you can have several PowerPoint presentations to different audiences, but connected to the same data model.
Cloning Charts, Excel and PowerPoint files
– Chart cloning (copy/paste) is possible only within the given file (i.e. copy a chart within a spreadsheet or copy a chart in a presentation).
– You can Save As Excel files with ActiveGraf active content. GrafData will be cloned, and you can change the GrafData name in the new file. Note that the new file will NOT be connected to any original PowerPoint, but can be connected as described below.
– You can Save As PowerPoint files with ActiveGraf content. The new PowerPoint file will be connected to the original Excel file.
Data Connection Wizard
If the file path and/or the file name were changed, a Data Connection Wizard will pop up when you open the PowerPoint presentation.
You can also manually initiate the Data Connection Wizard to link a different version of your spreadsheet to the presentation or dashboard.
How to import from .actg files
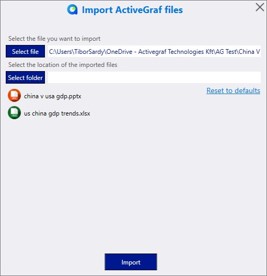
Follow these steps: – Double-click on the .actg file
– The Import Dialog appears (you may need to manually switch to the ActiveGraf server window, which will have an orange glow on your Windows Taskbar, depending on other software you have running)
– Select the destination folder where you want to place the Excel and PowerPoint files. Be careful with the folder name, it should not contain special characters. Corresponding database content will be merged to the ActiveGraf Server database automatically.
– Name your files (click on the file name). The system will warn you if files with the same name already exists in the defined location.
Note: To ensure that all data synchronization integrity is retained, the Import process does not allow the replacement of already existing files with new ones.
How to collaborate on ActiveGraf enabled files
With someone who has a valid ActiveGraf license
– Collaborate on a shared drive, or send the PowerPoint & Excel files. If you maintain the best practice of having your ActiveGraf enabled PowerPoints and Excels in the same folder, and the recipient of the files does the same, there is no need for the recipient to reconnect the files. The Data Connection Wizard will automatically open if the file names or relative location of the files to each other has changed – You can also use Package / Package All, to create a full content version of your ActiveGraf enabled use case, and send the .actg file.
With someone who does NOT have an ActiveGraf license
– PowerPoint: Save As the PowerPoint file to a PDF file, or select the „Show as saved image” on each chart and send the PowerPoint file. Only the static view of the ActiveGrafs will be visible. (Do not forget to switch them back before you continue working with the file.) – Excel: Collaborate on a shared drive, or send the ActiveGraf enabled Excel file (non ActiveGraf users can edit values and formulas, or add data and calculations in new or unused cells or worksheets, BUT should not change the original spreadsheet structure, as then ActiveGraf users of the same file will have to recreate the GrafData). When you get the file back, replace the original file with the new version.
All-in-One Webinar
Launch Time!
Find everything you need to know in order to build interactive scenario analysis dashboards and predictive presentations in the following videos.
Copyright 2025 ActiveGraf Inc. All rights reserved.